Is dit ook uw ervaring? Misschien heb ik gewoon verkeerde vrienden, kennissen, collega's, contacten en relaties in het beurswereldje. Om over de Koffiekamer maar te zwijgen :-) Er gaat echt geen dag voorbij en ik voer geen enkel gesprek met iemand of de woorden bubbel en krach vallen wel een keer.
Het verhaal is bekend: met name Amerikaanse aandelen zijn (peper?)duur en de S&P 500 heeft tientallen nieuwe all time highs neergezet in het afgelopen halfjaar - de technologie-indices nog niet één! Gooi daar een sausje van Fed-stimuli overheen en daar komen de bubbel- en krachverhalen en -scenario's vandaan.
Is dat terecht? In zijn column op Bloomberg haalt Barry Ritholtz - wat heb ik veel van die man geleerd - onderzoek en collega-columnisten aan voor een korte, bondige bubbelanalyse. Vijf puntjes maar. Keep it simple and stupid, houd ik van. Warren Buffett heeft er in essentie ook maar vijf om bedrijven te beoordelen.
Het is een vergelijking tussen nu en de internethype van eind jaren negentig. Gaat ie:
No. 1. Volume:
In the first quarter of 2000, there were 123 IPOs. In the first quarter of this year, there were 58 -- less than half as many, according to data compiled by Ritter.
No. 2. First-day returns:
The average return for an initial public offering in the first quarter of 2000 was a blistering 96 percent. This year, only 22 percent.
No. 3. Dividend Premiums
As exuberance reaches extreme levels, investors become bored by established, dividend-paying companies. In March 2000, speculative companies on average had a 43 percent higher valuation than the dividend-paying stocks. The comparable premium today for stocks in the S&P 1500 index is 26 percent, according to data from FactSet.
No. 4. Equity Issuance:
Companies raise cash from the secondary market when that window is open. Can that be used to evaluate periods of speculative excesses? Perhaps. In the first quarter of 2000, corporate cash derived from equity issuance was 20 percent; the most recent data is from the fourth quarter of 2013, and it showed the equity share of cash was only 11 percent.
No. 5. Share turnover:
Comparing share turnover is another way to distinguish the bubble era from today. The turnover rate in listed shares on the New York Stock Exchange in the first quarter of 2000 was an annualized 89 percent. In the first quarter of this year it was 58 percent.
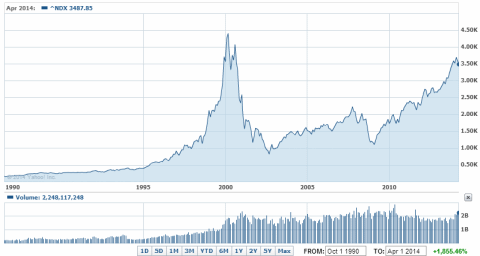
Géén bubbel dus, concludeert Ritholtz. U ook? Heb ik zelf nog een argument. Hier een lang plaatje van de Nasdaq 100, dé Amerikaanse technologie-index. Het patroon rond 2000 is een klassieke bubbel volgens het boekje. Fraaie bull-trap ook vlak na dé top. Zo'n bubbelpatroon zie ik nu (nog) niet.